Online forex broker, XM, is proud to announce that it has launched the world’s first forex Contest Arena. This fully functional Contest Arena is a web-based interface that gives registered clients the opportunity to register to as many forex contests as they wish. Once clients register for a contest through the Contest Arena, trading for the contest is carried out through the MT4 platform, without any of the restrictions or complications that are usually associated with traditional forex tournaments. - See more at:
Disclaimer
The analysis we provide is based on the average estimate of price movements in one day. Does not guarantee what we deliver is actually a proper and correct. Everything that happens in the decisions you make on your trading transaction is to be Your responsibilities.
Visit Us www.deryworldscorp.asia
What a difference a day makes as today's USD tumble was attributed to a modest miss in Q1 GDP revision (2.4% vs exp 2.5%), while the important PCE rose to a higher than expected 3.4%. USDX failed to reach the 85 resistance, but support looks to remain intact around 80.70. AUDUSD rebounded on higher than expected Capex spending plans but failed to reach our 0.9700 short. EUR and CHF were among the day's best performers. Tonight's April CPI figures (00:30 London) from Japan are expected to show improved data all around, which may justify the weak-yen policy and support yen crosses. With EUR outperforming most major FX lately, EURJPY will be particulat to watch as Japan's inflation data is released amid 13-month highs in JGB yields. CAD awaits tomorrow's March GDP figures, which will help determined the fate of our latest USDCAD longs.
Disclaimer
The analysis we provide is based on the average estimate of price movements in one day. Does not guarantee what we deliver is actually a proper and correct. Everything that happens in the decisions you make on your trading transaction is to be Your responsibilities.
Visit Us www.deryworldscorp.web.idVisit Us www.deryworldscorp.asia
Low volatility begets High volatility. Bollinger Bands are probably one of the most important indicators ever developed for measuring price action volatility.
In this one hour webinar you will learn how to use Bollinger bands volatility to spot the best instruments to trade and at the same time get highly accurate entry and exit signals within any time frame.
Register for this online webinar for free here
Disclaimer
The analysis we provide is based on the average estimate of price movements in one day. Does not guarantee what we deliver is actually a proper and correct. Everything that happens in the decisions you make on your trading transaction is to be Your responsibilities.
Visit Us www.deryworldscorp.web.idVisit Us www.deryworldscorp.asia
USD/JPY continued its surge higher and hit fresh highs. Without a pullback, can the pair continue higher? The rate decision and BOJ governor Haruhiko Kuroda’s speech are the main market-movers this week. Here’s an outlook for the Japanese events and an updated technical analysis for USD/JPY.
Last week The Japanese economy enjoyed firm growth in the first quarter of 2013, rising 0.9% in January-March, the quickest growth in a year. Shinzo Abe’s radical monetary policy is finally bearing fruit. Deflation is improving and the yen is weakening. Furthermore, Japanese core machinery orders edged up 14.2% in March beating forecasts for a 3.1% growth, the fastest growth in 8 years. In addition, also the BOJ contributed with an immediate plan to “calm the bond markets” and injected more money. In the US, economic indicators are not so good, but the dollar certainly has a reason to rise. Let’s Start:
Updates: Japanese economy minister Akira Amari said that “excessive JPY gains have been corrected a lot” and that “ it’s the government’s responsibility to “minimize” that effect”. USD/JPY dropped as low as 102 before rebounding, and trades around 102.40, far off from the highs of 103.30 seen on Friday. USD/JPY extended its fall on the not-enough hawkish statements from Evans, an FOMC member, and is at 102.25.
USD/JPY daily chart with support and resistance lines on it. Click to enlarge:
All Industries Activity: Tuesday, 5:30. Japan’s all industry activity improved in February, rising by 0.6% after a 1.6% fall in January. The expansion occurred mainly due to a recovery in tertiary activity. The increase was contrary to market forecast of a 0.6% decline. On a yearly basis, all industry activity dropped 2.5% in February compared to a 0.7% fall in the previous month. A drop of 0.3% is expected now.
Trade Balance: Wednesday, 0:50. The March seasonally adjusted trade balance deficit reached Y922 from Y1.09 billion deficit in the previous month. The 1.2% drop in deficit occurred due to a rise of 1.6% in exports from February and 2.4% on the year. The unadjusted merchandise trade deficit was a smaller than expected reaching Y362.4 billion from a year ago. An improvement to -0.61T is forecasted.
Monetary Policy Statement and BOJ Press Conference: Wednesday. The Bank of Japan kept monetary policy unchanged in April, in line with market forecast, following exceptional stimulus measures declared earlier that month to meet the 2% inflation rate target in two years. The BOJ switched its policy target from the overnight call rate to base money, a broad measurement of the amount of money the central bank pumps into the economy. No big change is expected this time, as the ambitious decisions from the important April 4th meeting are still being digested by the markets.
BOJ Monthly Report: Thursday, 6:00. The Bank of Japan announced an unprecedented decision to inject about $1.4 trillion into the economy in less than two years. The new Governor Haruhiko Kuroda said the monetary base would nearly double to 270 trillion yen ($2.9 trillion) by the end of 2014.
Haruhiko Kuroda speaks: Friday, 3:55. BOE Governor Haruhiko Kuroda will speak in Tokyo. He may talk about the positive developments in Japan’s economy over the recent month and about the new monetary policy. His words can cause volatility in the markets.
*All times are GMT.
USD/JPY Technical Analysis
Dollar/¥ began the week holding above the 101.44 line (mentioned last week). It then climbed and marked a top at 102.80. After a long struggle with this line, the pair finally made a breakout, rising above 103 and closing at the high level of 103.21.
Technical lines from top to bottom
We start from higher ground once again.: 108.60 capped the pair in 2008 and worked as support during 2006. 107.16 provided support in 2007 and later worked as resistance in 2008.
105.50 is above the round number of 105 and worked as resistance during 2008. It worked as support later in the year. Below, 104.60 slowed the pair’s rise in early 2008.
103.50 is a strong line that worked as support for the pair in July and September 2008 and is a key to any strong upside move. 102.80 capped the pair in May 2013, and could work as the immediate pullback line.
101.80 worked as a cushion for the pair in May 2013, and it is minor support now.. The 101.44 line, which was the post crisis high seen in April 2009. is now critical support.
The obvious number below is the very round number of 100 and would be closely watched on any drop. 98.90 capped the pair in June 2009 and serves as minor resistance.
A stronger line is the 97.80 line, which was a peak back in 2009 and was reached in April 2013. The pair stumbled below this line, which is getting weaker. The round 97 line worked as important support in May 2013.
The March 2013 peak of 96.71 is the next line, which now switches to support. 95.88 provided a temporary stop on the way up and was also the swing low on a fall during April. The round number of 95 is also watched by many and will remain critical support on a reversal.
I temporarily turn from bullish to neutral on USD/JPY
The long term direction of the pair remains up: the extreme monetary and fiscal policies coming from Japan are likely to push the yen lower across the board. In the US, the fiscal tightening and the hints about unwinding QE as soon as this summer can boost the dollar across the board.
However, forex trading is usually not a one way street. After the big moves in the past two weeks, we could see some consolidation, at least a temporary one. It is impossible to call a top or a bottom, but perhaps we will get a pause.
Disclaimer
The analysis we provide is based on the average estimate of price movements in one day. Does not guarantee what we deliver is actually a proper and correct. Everything that happens in the decisions you make on your trading transaction is to be Your responsibilities.
Visit Us www.deryworldscorp.web.idVisit Us www.deryworldscorp.asia
May 16, 2013 – AUD/USD (daily chart) has continued its week-long plunge that initiated on a clean breakdown below the major 1.0150 support level late last week. That move broke the longstanding trading range that had been in place for the previous ten months. Since that breakdown, price has proceeded to breach parity (1.0000) and then hit key support further down around the 0.9850 level yesterday. Currently, price has broken below that level as well, establishing a new 11-month low in the process. The downtrend is currently showing few signs of relenting. With key upside resistance now residing around parity, the next major downside price objectives reside around 0.9650 and then 0.9400, both of which are important prior support/resistance levels.
Disclaimer
The analysis we provide is based on the average estimate of price movements in one day. Does not guarantee what we deliver is actually a proper and correct. Everything that happens in the decisions you make on your trading transaction is to be Your responsibilities.
Visit Us www.deryworldscorp.web.idVisit Us www.deryworldscorp.asia
May 14, 2013 – GBP/USD (daily chart) has shown clear signs of leaning towards a resumption of the strong bearish trend that has been in place since the beginning of the year. The current bearish resumption occurs after a substantial bullish correction that brought price up from the 1.4830 long-term low in mid-March up to the 1.5600-area major resistance high in early May, which was right at the 50% Fibonacci retracement of the steep January-March plunge. After turning down from that 50% correction high just last week, price has fallen dramatically, breaking down below both the key 1.5400 level as well as an important uptrend support line extending back to the noted mid-March low.
Currently, price has fallen quickly towards key support around 1.5250, which is also around the area of the 50-day moving average. A breakdown below this strong support level would provide further indication of a bearish trend resumption, with major downside objectives around 1.5000 and then a potential re-test of the long-term 1.4800-area low. Strong upside resistance now resides around the broken 1.5400 level.
Disclaimer
The analysis we provide is based on the average estimate of price movements in one day. Does not guarantee what we deliver is actually a proper and correct. Everything that happens in the decisions you make on your trading transaction is to be Your responsibilities.
Visit Us www.deryworldscorp.web.idVisit Us www.deryworldscorp.asia
So far this week, we haven’t seen any major releases from the Eurozone or the US, and predictably, EUR/USD has responded with little movement. The pair continues to test the 1.31 line in Wednesday’s European session. With what looks to be another quiet day, today’s releases could have added significance. The lone Eurozone release is German Industrial Production. Later on, the US will release Crude Oil Inventories and auction off 10-year bonds.
Here is a quick update on the technical situation, indicators, and market sentiment that moves euro/dollar.
EUR/USD Technical
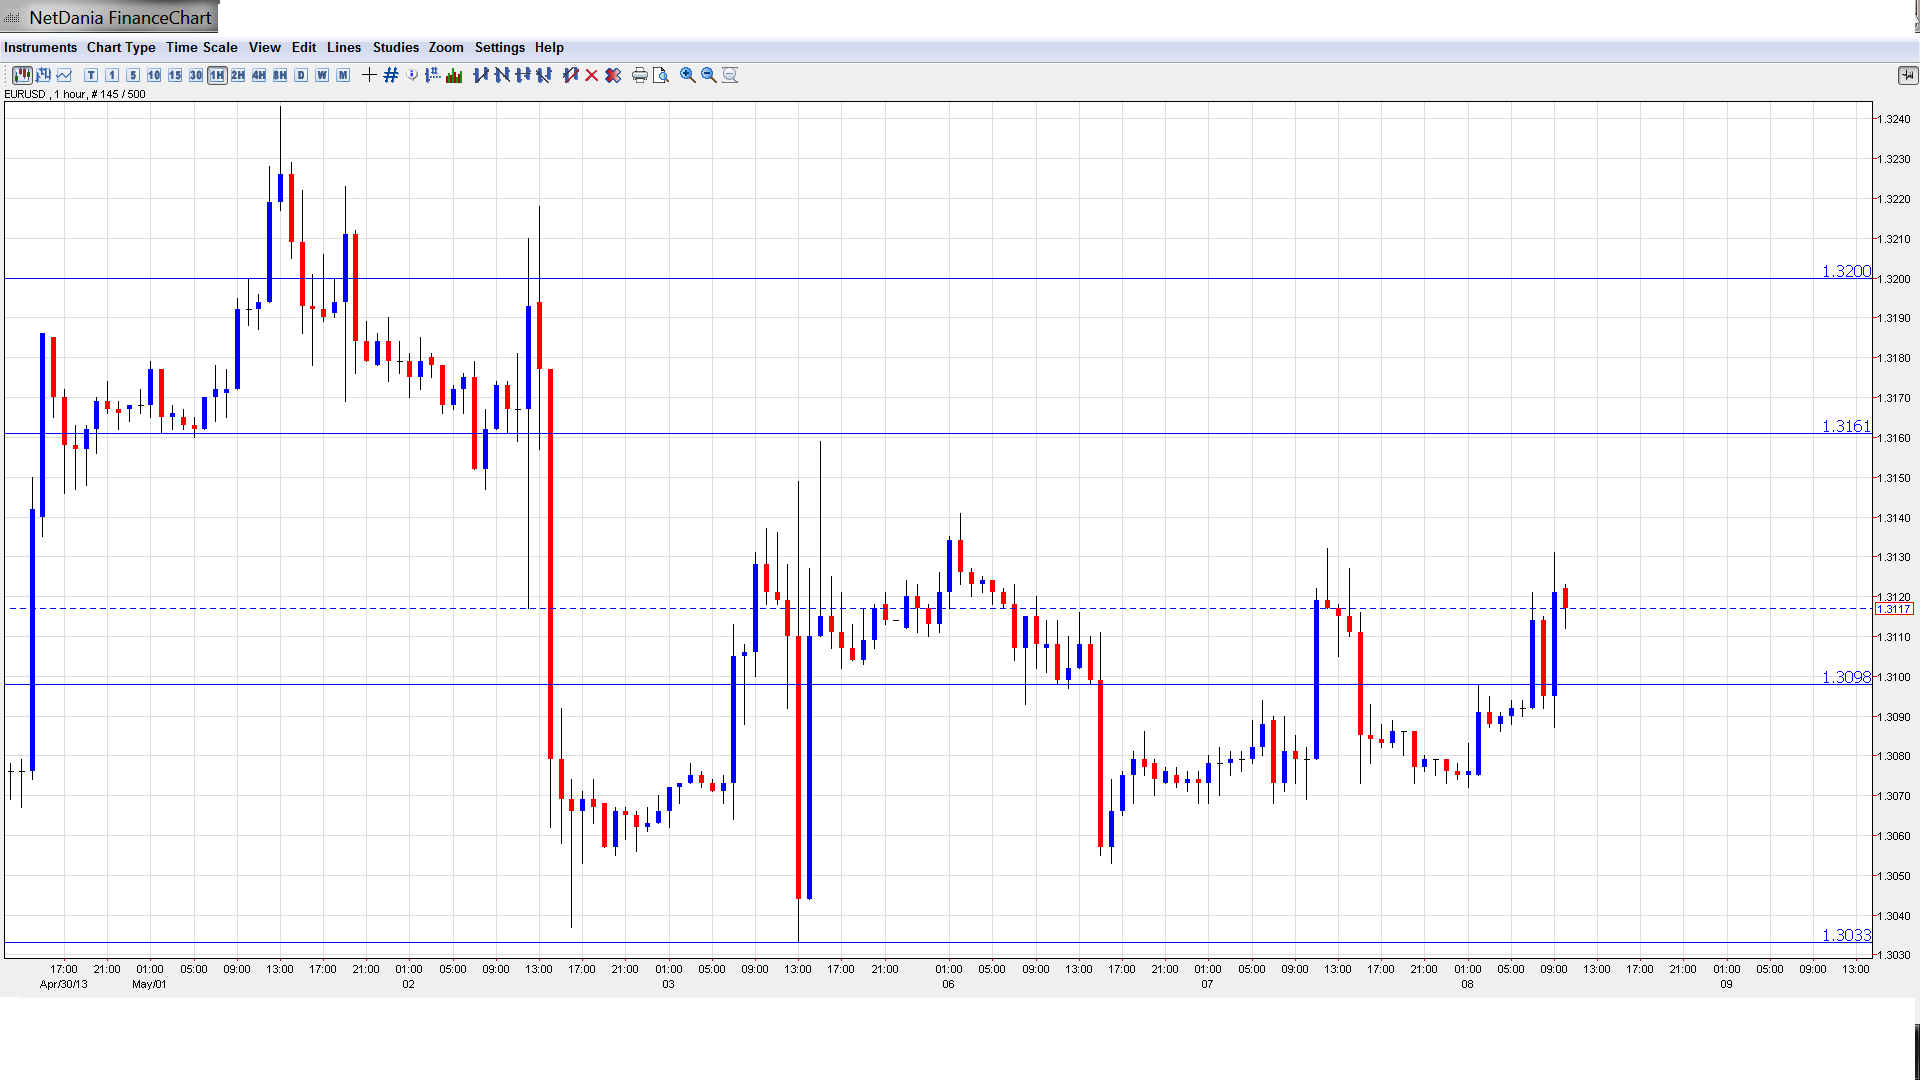
Asian session: Euro/dollar crossed above the 1.31 line late in the session and consolidated at 1.3011. The pair is testing 1.31 in the European session.
Current range: 1.31 to 1.3160.
Further levels in both directions:
Below: 1.31, 1.3030, 1.3000, 1.2960, 1.2880, 1.2805, 1.2750 and 1.27.
Above: 1.3160, 1.32, 1.3255, 1.3290, 1.3350 and 1.34.
1.3160, a critical line, is providing resistance.
On the downside, the pair is testing 1.3100. 1.3030 is stronger.
Euro continues to trade close to 1.31 – click on the graph to enlarge.
Draghi open to further cuts: When the ECB cut rates last week to 0.50%, the euro initially move higher, but then dropped after Draghi stated that the ECB would consider negative deposit rates. The reason? Such a move could lead to a flow of funds outside the Eurozone in search of better rates. On Monday, ECB head Mario Draghi stated that ECB was open to lowering rates further, as well as cutting its deposit rates below zero. This time, talk of negative rates did not spook the markets, and the euro remained steady.
Letta calls for growth, not austerity: New Italian Prime Minister Enrico Letta is on a European tour, and has called for an end to strict austerity. Letta wants to see the Eurozone leaders concentrate on renewing growth, rather than simply implementing more austerity measures. He received an enthusiastic welcome in Paris from French President Francois Hollande, whose popularity has plummeted due to his government’s austerity measures. Letta’s remarks were not received as warmly when he visited Berlin, as Germany is tired of bailing out other zone members and is a strong proponent of fiscal consolidation. We can expect some lively exchanges at future Eurozone summits regarding how to breathe life into the Eurozone’s ailing economy.
Greece gets good grade from IMF: The IMF released a report this week which commended Greece for its efforts to reduce crippling deficits, noting ”exceptional progress” in the past four years. The IMF also said that Greece had increased competitiveness and kept the financial sector stable. At the same time, the country has failed to tackle tax evasion or cut the bloated public sector, and these factors had contributed to a deep recession. We are no longer hearing whispers of a Greek exit, but the country may still need the helping hands of the IMF and the ECB until the economy shows further improvement.
Is Spain on the road to recovery? Spanish releases started the week started in fine fashion, as Unemployment Change dropped by 46.1 thousand. This surprised the markets, which had expected a rise of 17.1 thousand. Prime Minister Mariano Rajoy has stated that he expects the unemployment rate, currently at a record 27%, to start dropping in 2014 as the economy improves. Rajoy has implemented tough austerity measures, and further solid numbers out of Spain would be a strong indication that the austerity program is bearing fruit.
Disclaimer
The analysis we provide is based on the average estimate of price movements in one day. Does not guarantee what we deliver is actually a proper and correct. Everything that happens in the decisions you make on your trading transaction is to be Your responsibilities.
Visit Us www.deryworldscorp.web.idVisit Us www.deryworldscorp.asia
EUR/USD is steady, as the pair was trading in the mid-1.35 range. In the US, the GDP release looked awful, posting its first decline since 2009. The Federal Reserve wrapped up its policy meeting, and said that QE3 would continue. Thursday is another busy day, with a host of economic releases. In Germany, Retail Sales declined, but the Unemployment Change was very sharp. Today’s key release is US Unemployment Claims.
EUR/USD Technical
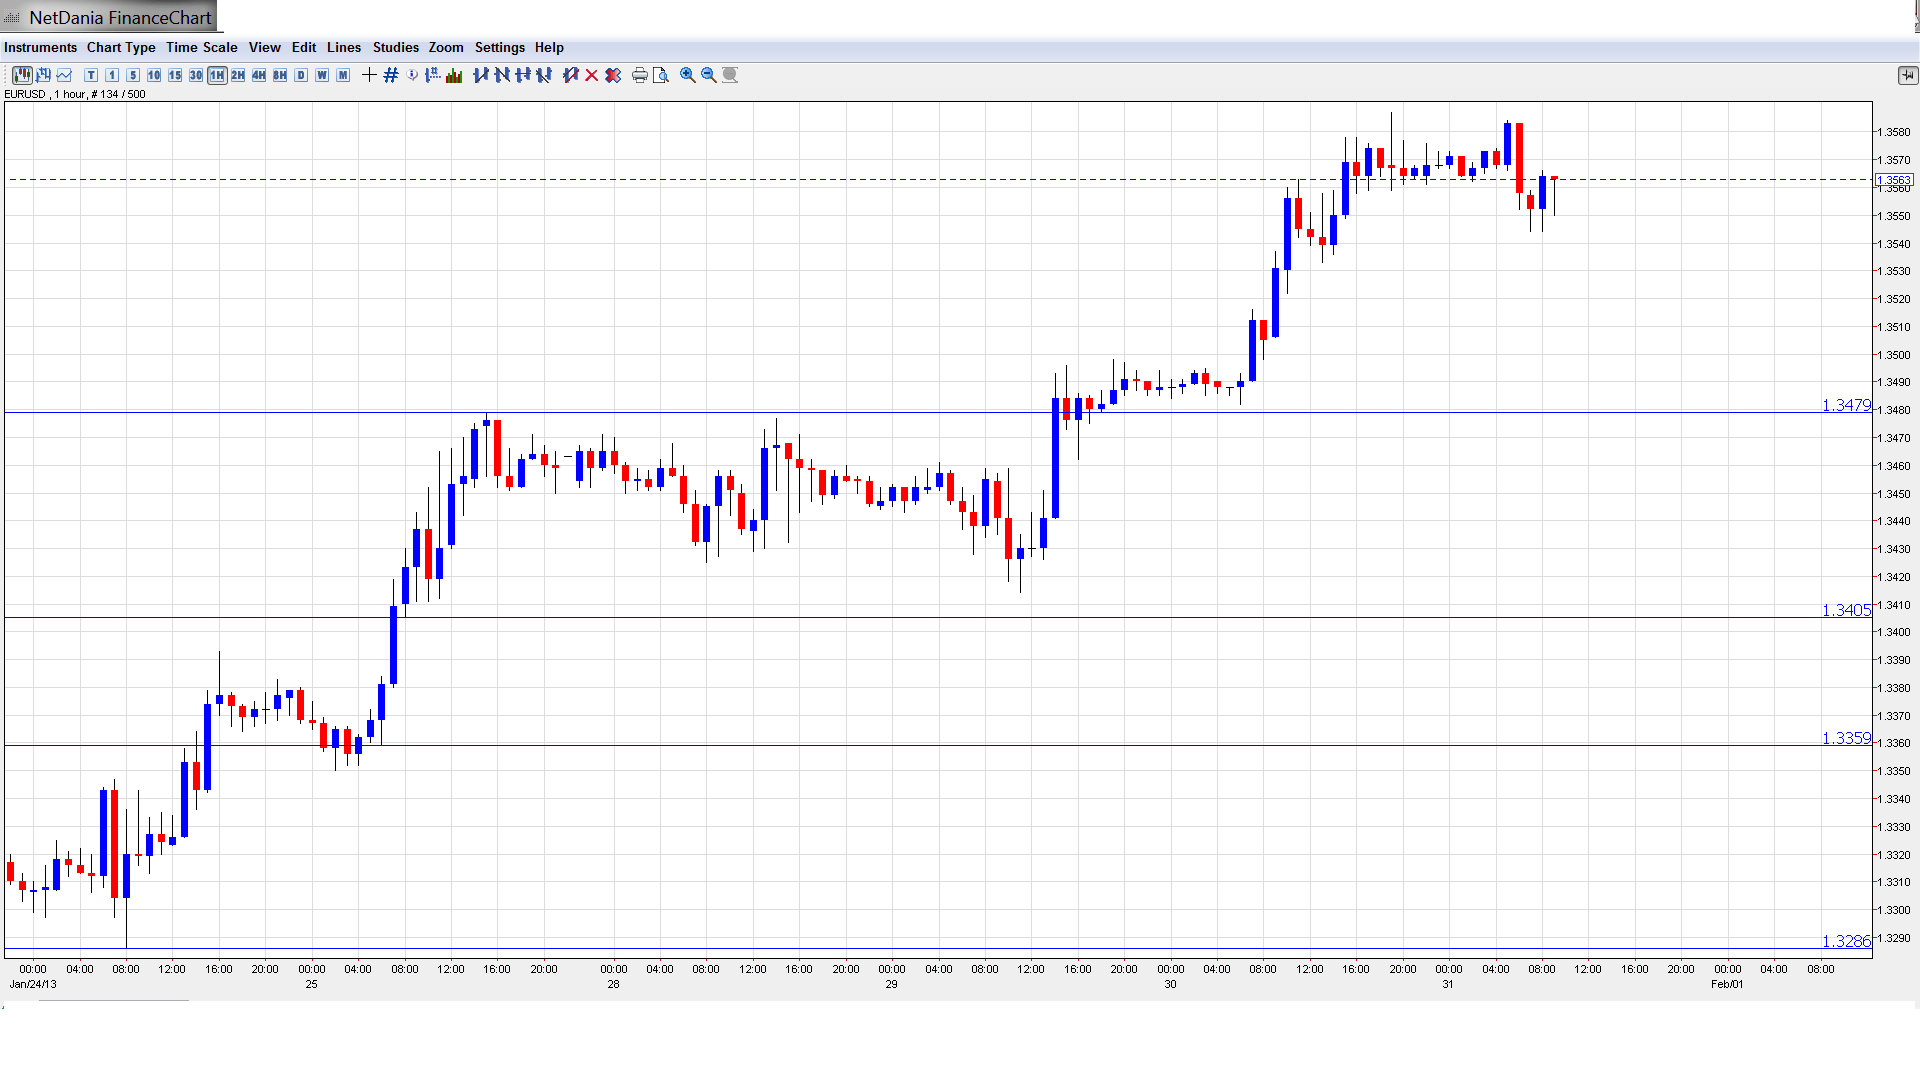
Asian session: Euro/dollar was quiet, reaching a high of 1.3585. The pair consolidated at 1.3555. The pair is unchanged in the European session.
Euro/dollar steady after weak US data – click on the graph to enlarge.
EUR/USD Fundamentals
7:00 German Retail Sales. Exp. 0.1%. Actual -1.7%.
All Day: German Preliminary CPI. Exp. -0.5%
7:45 French Consumer Spending. Exp. 0.3%. Actual 0.0%.
8:55 German Unemployment Change. Exp. 9K. Actual -16K.
12:30 US Challenger Job Cuts.
13:30 US Unemployment Claims. Exp. 362K.
13:30 US Core PCE Price Index. Exp. 0.1%.
13:30 US Employment Cost Index. Exp. 0.6%.
13:30 US Personal Spending. Exp. 0.4%.
13:30 US Personal Income. Exp. 0.7%.
14:45 US Chicago PMI. Exp. 51.1 points.
15:30 US Natural Gas Storage. Exp. -202B.
EUR/USD Sentiment
No surprises from Fed: All eyes were on the Federal Reserve this week, as the powerful US central bank met for a two-day policy meeting. There were no surprise developments, as the Fed stated it would continue its open-ended QE3 program until the outlook for the labor market “improves substantially”. This put to rest any doubts that the current round of QE, under which the Fed is purchasing $85 billion a month in securities, might be terminated anytime soon. The Fed maintained its ultra-low benchmark interest rate, saying there would be no change until unemployment drops below 6.5%. With US unemployment close to 8%, we will likely be hearing this refrain for the foreseeable future.
Euro sparkles: The euro continues to fly high, and has climbed above the 1.35 line, its highest level since December 2011. EUR/USD has now jumped almost 500 points since early January. The continental currency has been bolstered by improving German data, as well as optimistic forecasts about the Eurozone economy from ECB President Mario Draghi and others. These officials acknowledge that the Eurozone is going through a tough time, but are confident that the economy will bounce back later in 2013. Although a range of indicators, notably employment and PMI numbers, point to a deepening recession and continuing fallout from the debt crisis, the euro is enjoying the ride, at least for now.
German Data Mixed: The German locomotive will have to get back on track if the Eurozone is to get back on its feet in 2013. So how is the German economy doing? The answer seems to be lukewarm, based on recent data. Business Sentiment has improved, and unemployment numbers were excellent. At the same time, inflation indicators have been in negative territory, pointing to subdued economic activity. The manufacturing sector is struggling, and Retail Sales fell by 1.7%, well below the estimate. The markets are well aware that as goes Germany, so goes Europe, and will be hoping for better news from the bloc’s largest economy.
Markets fret over weak US housing numbers Although the US has posted been able to point to some strong releases recently, recent housing numbers have been in the tank. New Home Sales was a disappointment, falling well below the estimate. Pending Home Sales fared no better, plunging by 4.3%. This was the key indicator’s worst showing since last May. These dismal readings points to weakness in the US housing industry, a critical component for economic growth. The bumpy US recovery will continue to limp along if these numbers don’t improve soon.
US recovery continues to hit bumps: The extent of the US recovery is anyone’s guess, as US numbers continue to keep the markets guessing. Employment and retail sales numbers have been very positive, but this has been offset by weak housing and consumer confidence data. This week’s GDP reading was abysmal, as the US economy declined by 0.1%. Although a very modest loss, there is bound to be negative market reaction, as this was the first decline since 2009, and the markets had anticipated a 1.1% gain. The US will be releasing key employment numbers on Thursday and Friday, and the markets will be hoping that the US employment picture continues to brighten.
Disclaimer
The analysis we provide is based on the average estimate of price movements in one day. Does not guarantee what we deliver is actually a proper and correct. Everything that happens in the decisions you make on your trading transaction is to be Your responsibilities.
Visit Us www.deryworldscorp.web.id
British net lending to individuals and mortgage approvals rose; Swiss data mixed; solid Italian auction. Market awaits ADP, GDP and FOMC. A new set of Premium Insights has been issued ahead of Wednesday's FOMC decision. 2 new trades in EURUSD, 2 new in USDJPY, 2 dual trades in GBPUSD, 2 new in AUDUSD, 2 new in EURGBP, 2 new in EURJPY and 2 new in CADJPY. Gold, silver and US crude oil trades will be updated shortly.
USD is mixed in the ongoing session. EURUSD strengthened to a 1.3562 session high, USDJPY rose to 91.39 but commodity dollars weakened and still trade near session lows.
British net lending to individuals increased in December and reached GBP 1.7 bln from prior GBP 0.1 bln and mortgage approvals rose to 56K from 54K which is the highest level since 09/2012. GBPUSD rose alongside the euro and trades around 1.5775.
The CHF strengthened despite a set of mixed data out of Switzerland. The UBS consumption indicator rose in December to 1.34 from prior 1.23 but the KOF economic barometer fell sharply in January to 1.05 from previous 1.29. USDCHF fell to 0.9155.
Italy sold 5 and 10 year BTPs totaling EUR 6.5 bln vs. 4.5-6.5 bln target. Both average yields declined and cover was mixed. Germany allotted EUR 1.637 bln of 30 year Bund vs. 2 bln target. The average yield rose to 2.45% from 2.34% and cover fell to 1.8 from 2.7. 18.2% were retained.
The US session begins at 8:15 am ET with the ADP report that is expected to decline to 164K in January from December's 215K followed by Q4 GDP at 8:30 am that is forecasted to slow to 1.2% from prior 3.1% y/y. Markets will then wait for the FOMC decision and statement at 2:15 pm. The FOMC is likely to reiterate its stance on QE so today's meeting could be a non-event.
NZD traders await the RBNZ rate decision and statement at 3:00 pm. Rates are widely anticipated to remain steady at 2.5%.
Disclaimer
The analysis we provide is based on the average estimate of price movements in one day. Does not guarantee what we deliver is actually a proper and correct. Everything that happens in the decisions you make on your trading transaction is to be Your responsibilities.
Visit Us www.deryworldscorp.web.id
GBP/USD was down slightly this week, as the pair closed just below the 1.58 line, at 1.5795. The pound has now shed 450 points against the US dollar since the beginning of the year. There are only four events scheduled in the upcoming week, with the highlight being Manufacturing PMI. Here is an outlook of the events and an updated technical analysis for GBP/USD.
Both the UK and the US produced mixed numbers this week, resulting in modest losses for the pair. Both countries had strong employment numbers, but British GDP recorded a decline, while US housing numbers were well below expectations.
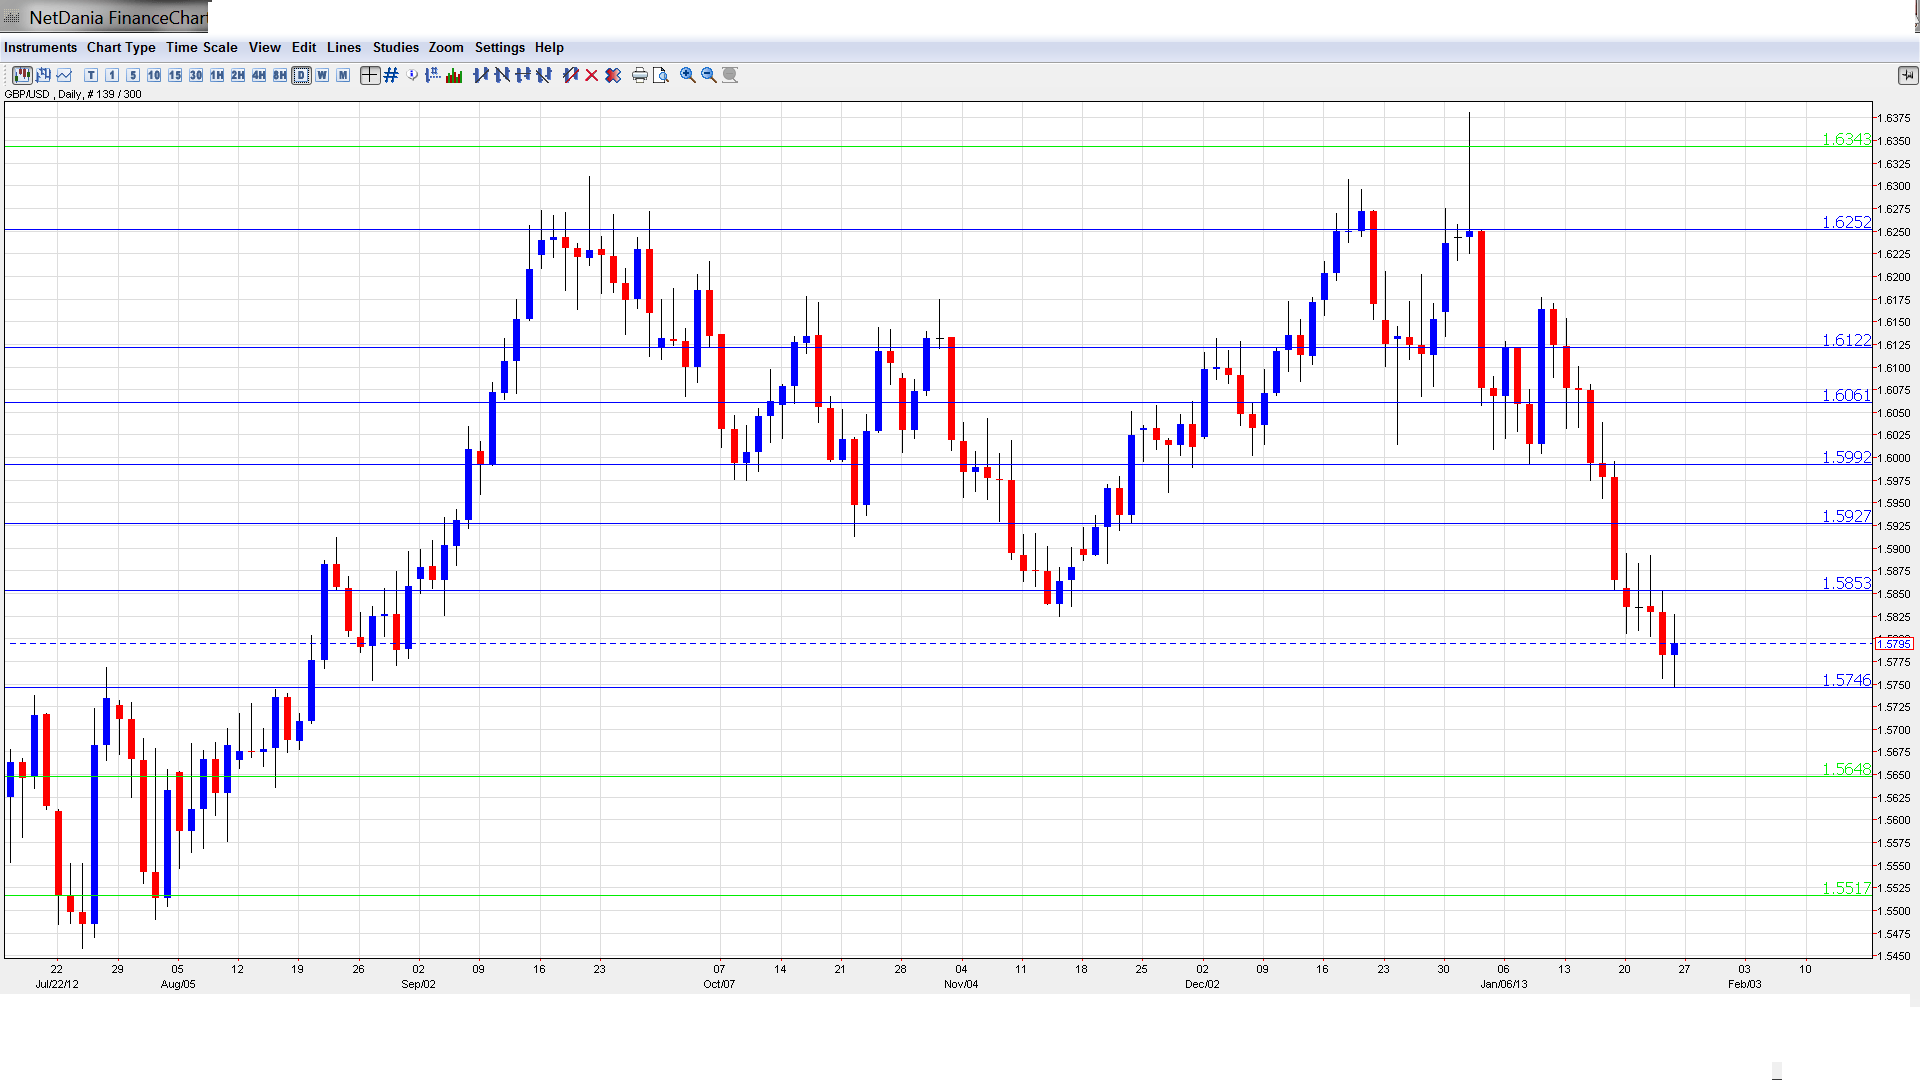
GBP/USD graph with support and resistance lines on it. Click to enlarge:
Net Lending To Individuals: Wednesday, 9:30. Increased consumer debt indicates that financial institutions are comfortable lending to consumers, and that consumers are borrowing more. The indicator has looked weak of late, posting two consecutive declines. The markets are expecting an improvement in the upcoming reading, with a forecast of a gain of 0.9 billion pounds.
GfK Consumer Confidence: Thursday, 00:01. Consumer Confidence continues to be in the deep-freeze, with little optimism about the UK economy. The previous releases worsened by -29 points, and little change is expected in the January release.
Nationwide HPI: Thursday, 7:00. This housing inflation index posted very weak readings for most of 2012, pointing to very subdued activity in the UK housing market. The markets are expecting an improvement in the January release, with an estimate of a 0.3% gain.
Manufacturing PMI: Friday, 9:30.The trading week wrap up with the highlight of the week. Manufacturing PMI is a key release, and an unexpected reading could impact on the movement of GBP/USD. The index surprised the markets in December by crossing above the 50 point level, for the first time since May. The estimate for January stands at 51.o points, which would indicate very slight expansion in the manufacturing industry.
*All times are GMT
GBP/USD Technical Analysis
GBP/USD opened the week at 1.5855. The pair quickly reached a high of 1.5892, but then dropped all the way to 1.5746, briefly breaching support at 1.5750 (discussed last week). GBP recovered partially, and closed the week at 1.5795.
Technicallines from top to bottom:
We begin with resistance at 1.6343, which was breached immediately after the fiscal cliff agreement on New Year’s Day, but has remained intact since that time. The pound has been on a steep slide since that time. Next, there is resistance at 1.6247. This is followed by 1.6122. The pair easily broke through resistance at 1.6060 and 1.5992 earlier this month, as the pound was no match for the greenback.
Next, 1.5930 could not hold on, as the pair pushed below the 1.59 line. Below, 1.5850 started off the week as a weak line, but was breached and has now reverted to a resistance role. The pound showed some improvement at the end of the week, so this line could see further activity if this upward trend can be sustained.
GBP/USD is receiving weak support at 1.5750. This line was breached on the pair’s downward push, but remained intact at week’s end. We encounter stronger support at 1.5648. Next is the line of 1.5516 has held steady since August of last year. This is followed by support at 1.5406, which has not been tested since July 2012. Below, there is support at 1.5361, which has held firm since June 2012. The pound started a rally at that time, which lasted until September. The final support level for now is at 1.5282.
Disclaimer
The analysis we provide is based on the average estimate of price movements in one day. Does not guarantee what we deliver is actually a proper and correct. Everything that happens in the decisions you make on your trading transaction is to be Your responsibilities.
Visit Us www.deryworldscorp.web.id
EURUSD finally broke to the upside: a move which was expected after a few days of sideways price action in a shape of a triangle pattern. The pair already passed the 1.3400 resistance level which now opens the door for 1.3500 or even 1.3550 level for the next few days. The trend is bullish as long as market trades above 1.3260. Meanwhile, any pull-back to 1.3350 should prove corrective.
GBPUSD
The pound fell to a new low against the USD and slowed down just 5 pips from 1.5750 projected level. Notice that pair now has five waves down from 1.6180: this is the first evidence of a coming bounce, especially if we respect the bullish divergence on the RSI. The larger pull-back however could prove corrective and may stop at 1.5900 swing level that will may react as a resistance.
Disclaimer
The analysis we provide is based on the average estimate of price movements in one day. Does not guarantee what we deliver is actually a proper and correct. Everything that happens in the decisions you make on your trading transaction is to be Your responsibilities.
Visit Us www.deryworldscorp.web.id


 Visit Us www.deryworldscorp.asia