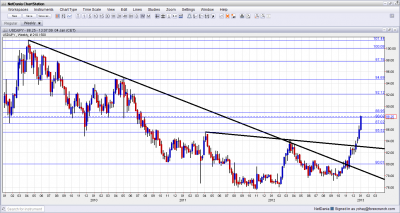
The rally of USD/JPY is just getting sharper and looks like a straight line up. At 88.26 at the time of writing, the pair is already at levels last seen in July 2010, before the first BOJ intervention of September 2010. Where next?
Many are expecting a pullback, and perhaps the US Non-Farm Payrolls could be the trigger for a pullback, regardless of the result. However, a combination of huge political will from Japan together with doubts about the infinity of the Fed’s QE programs requires a look at the next levels.
The 88 line was a double bottom during 2010. This is broken. 88.95 is the next line – this was support in early 2010.
90 is a round number but hasn’t served as support or resistance. Further above, 92.12 worked in both direction in 2009 and 2010.
A very important line is 94.70 – which capped the pair for long months in early 2010. Even higher, 97.80 capped the pair in late 2009.
The very round number of 100 is of course very important, and the last line if the vertical move continues, is 101.44, a peak in early 2009.
For more lines in the shorter term and events, see the USDJPY analysis.


No comments:
Post a Comment