

Trend lines are universally used by almost all traders. They are a common place for all traders to
begin their technical analysis. The
problem is that a trader becomes too subjective in their trend line
drawing. Many traders will draw on
separate occasions two totally different trend lines based on the identical
information, depending on his inclination each time, thus consistency and
uniformity are totally lacking. Not all
trend lines are correct, in the end only one is. Throughout exhaustive research, I have
arrived at an effective method to select the points essential to the proper
construction of a trend line. Once
learned and applied, trend line analysis is no longer subjective, it becomes
completely mechanical. Trend line breakouts
are precisely defined and price projections can easily be calculated.
Supply and demand create price movement. Specifically, should supply exceed demand,
price declines; conversely should demand exceed supply, price advances. This is the basic economic theory accepted by
all traders that creates the market. In
order to illustrate this we construct an ascending line to represent demand and
a descending line to represent supply.
The difficulty in constructing trend lines becomes apparent when
choosing the specific points to select and connect creating the trend
line. As in many aspects of trading,
human nature tends to interfere greatly in the proper construction of trend
lines.
The first major error traders posses when creating trend
lines is working from past to present, in other words working from left to
right on the chart in their construction of the trend line. This is incorrect, for this reason alone;
recent price activity is more significant than historical price activity. After all, the forex market is the most
dynamic market in the world, meaning it is changing all the time. This approach will seem unorthodox to most
trader at first, but in actuality, this is the number one mistake that traders
make when creating trend lines. We are
accustomed from children to read everything from left to right, correct? When drawing trend lines we must learn to
read like the Japanese do, from right to left.
Success in creating trend lines requires both an attention to detail and
a pattern of consistency. Imprecision and disregard for detail are the
common practice in creating trend lines, which will result in the construction
of multiple trend lines forcing the trader to hope one of the trend lines will
correctly define the trend.
The first step to trend line construction, and most
important, is the selection of the two points to create the trend line
with. As I stated above, when pursuing
to construct a trend line we must read like the Japanese, from right to
left. All trend line analysis will be
done on the four hour chart compression.
By process of elimination of all chart compressions, I have concluded
that only the four hour compression is needed.
The four hour compression generates less trend line breaks and more
accurate price projections than any other time compression. All analysis shown of trend lines will be
conducted of the four hour compression.

In order to create a trend line, it is necessary to locate
the two points to create the trend line.
In this example we will be talking about a demand trend line
(uptrend). An uptrend is created when
demand exceeds supply; this is where the name demand line is derived from. When choosing the points to create a demand
line we are focusing on points of support.
True points of support are only those which low has two candles to the
left of it and two candles to the right of it which lows do not exceed the low
you are using. See the examples below for reference of true support points.

In the chart above, I have marked the two points that will
be used to create the demand line, remember only two points are used to create
our trend lines. Notice how I refer to
the most recent point of support on the chart as the 1st point,
remember we trade the most dynamic market in the world, right to left is the
key. To find the second point of the
demand line we look for the very next point of support that has two candles to
the left and two to the right that do not exceed the low of the support
point.

Once we have created of trend line, our next step is to use
this trend line to create a downside price projection once the market opens a
candle on the four hour chart below the demand line. Note I only say once the market opens a
candle, mentioned nothing about close because only the open of a candle is
necessary to create the price projection.
The price projection is created this way; you take the highest high
created above the demand line and mark it with a vertical line. As pictured in
the example below:
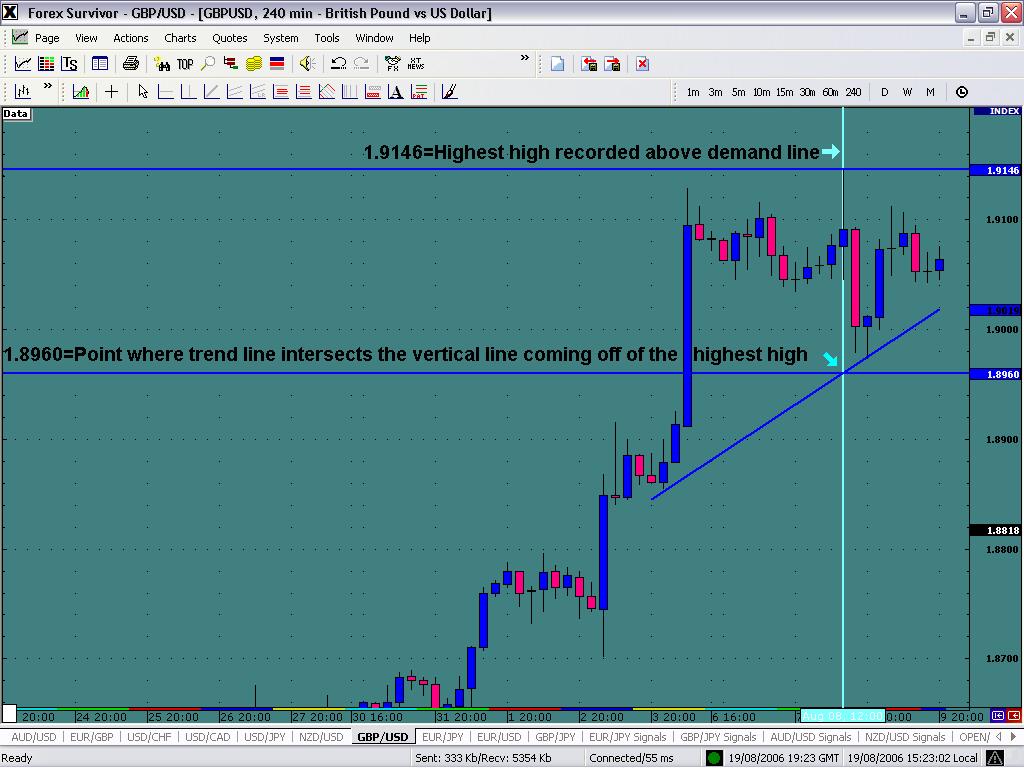
Next you need to take a horizontal line and mark the point
where the vertical line coming from the highest high recorded above the trend
line intersect with the trend line. What
seems complicated at first will be much easier observed and understood in the
example below.


Note the two values listed on the chart. In the next step we take the difference
between the highest high recorded above the demand line and the point where the
demand line is intersected by the vertical line.
Highest High 1.9146
-
Point of intersection
1.8960
0.0186
We get a difference of 186 pips. This number becomes our
price projection. The final step in the
process is the point of application of the price projection. The price projection will be 186 pips to the
downside once a four hour candle has opened below the demand line. It is key to become accustomed to this
technique because price usually reacts quickly to the downside once a candle
has opened beneath the demand line.
Valuable pips will be lost if the trader does not react quickly in many
cases.

The price projection is made at the open of the first candle
to open below the demand line. For visual reasons above the candle has closed
also, but the price projection should be projected immediately following the
open of the candle. Remember, we don’t
need the candle to open and close below the demand line in order to make our
price projection, only the open is needed.
Above in the example, we have an open value of the first candle below
the demand line at 1.9010. From this value we will subtract the 186 pip
difference we got from step 2.
Open below demand line 1.9010
-
Difference from Step #2
0.0186
1.8824
1.8824 becomes our price projection to the downside from the
open of 1.9010. This is a 186 pip
potential trade.

Notice the price projection marked at the bottom of the
page. The line was place 186 pips below the open of the first candle below the
demand line. Let’s see the trade just one candle after entry.

Note the rapid decline in the value of the currency once it
breaks the demand line. Let’s see if it
reaches the full price projection.
Notice how price fulfilled the 186 pip price
projection. What may seem at first to be
a complicated task, once reviewed and practiced by traders becomes a very easy
and profitable way to trade. Trend line
projections give the trader the best overall view of where the market will be
going. In the above examples we have
discussed demand lines and the downside price projections once the demand line
is broken. In the next section we will
discuss supply lines and the upside projections that are created from supply
line breaks. The same technique is used
in both instances except you are using know a supply line instead of a demand
line and you will be projecting a upside breakout instead of a downside
breakout.
In order to create a supply line, it is necessary to locate
the two points that create the supply line.
Remember that a supply line is the same thing as a down trend line. A supply is created when supply exceeds
demand; this is where the name supply line is derived from. When choosing the points to create a supply
line we are focusing on points of resistance.
True points of resistance are only those which high has two candles to
the left of it and two candles to the right of it which highs do not exceed the
high you are using as your point of resistance. See the examples below for
reference of true resistance points.

Notice how both points of resistance have two candles to the
left and two candles to the right that do not exceed the high of the resistance
point being used. Next we connect these
two points of true resistance to create our supply line.

Once we have created the supply line we want to draw a
vertical line through the candle that has the lowest recorded low below the
supply line. From this line we want to
record the value where the vertical line intersects the supply line and also
the value of the lowest recorded low beneath the supply line.


By calculating the difference of these two values we arrive
at the price projection pip value. In
this example we want to perform the following equation:
Value of trend line a lowest low intersection 141.75
-
Lowest recorded low beneath supply line 139.72
203 pips
We have now arrived at a projection point of 203 pips to the
upside from the open of the first candle above the supply line.
We are now waiting for the first candle to open above the
supply line so we can add 203 pips to that to arrive at our exact price
projection.

The first candle has opened above the supply line so it is
possible to calculate the price projection by adding 203 pips to the open
price.

Price projection of 203 pips targeted. This concludes the section on supply and
demand line breaks and price projections.
Attached are several power point examples to help you better understand
this technique.
Stop Loss for
Trades with less than 90 pip price projection
for trades with less than a 90 pip price projection a stop
loss of 50% of the price projection is used. This
creates a 2:1 reward/risk
ratio.


45 pip price projection paid out in the first 4 hour
candle. From the open of the open of the
4 hour candle that broke the supply line to the upside @149.22 price didn’t
even go one pip against in this case, but you can still notice the 23 pip stop
placed on the chart.
Stop loss for
trades with 90 and greater pip price projection
For trades with a price projection of 90 pips and greater a
stop loss of 33% of the calculated price projection is used. This creates a 3:1 reward/risk ratio.

On this specific trade a 135 pip price projection has been
calculated. By taking 33% of this price
projection a 45 pip stop is calculated.

Additional
Information
To protect winning positions, when any trade is 40 pips in
profit, it is strongly advised to change your stop to 10 pips profit. This technique was derived after seeing
several trades in large profits turn bad.
The worst thing I believe for a trader to see, is a profitable position
turn negative. This way you at least
lock in 10 pips profit by moving your stop once in profit 40 pips
FILTERS:
If any of the four
qualifiers are true, the trendline break is valid.
Upside breakout
qualifiers
Qualifier 1: The price bar prior to an upside breakout must be a down close.
Qualifier 2: The current price bar’s open must be greater than both the current TD
Supply Line and the previous price bar’s close and must then trade at least one
tick higher.
Qualifier 3: The previous price bar’s close plus the previous bar’s “buying pressure”
must be below the current price bar’s TD Supply Line price level.
First,
we need to know how to calculate the “buying pressure” of the previous bar.
It’s quite simple: We take the low of a bar and the close of the bar. Say it
closed at 1.8559 and the low was 1.8531. We take the difference, and add that
to the close. 1.8559-1.8531 = .0028. 1.8559 + .0028 = 1.8587. So we have 1.8587
as our “buying pressure” value. If our “buying pressure” value is above
the trendline, then we do not take the trade, as, theoretically, the buying
momentum has been “exhausted before the penetration of a TD line.” Similarly,
if the buying pressure is below the TL, then watch for an opportunity of a
trendline break.
Qualifier 4: The current price bar’s open must be above both the previous two price
bars’ closes, and the current price bar’s TD Supply Line must be above the
previous price bar’s high.
Downside breakout
qualifiers
Qualifier 1: The price bar prior to a downside breakout must be an up close.
Qualifier 2: The current price bar’s open must be less than both the current TD
Demand Line and the previous price bar’s close and must then trade at least one
tick lower.
Qualifier 3: The previous price close minus the previous bar’s “selling pressure”
must be above the current price bar’s TD Demand Line price level.
Qualifier 4: The current price bar’s open must be below both the previous two price
bars’ closes, and the current price bar’s TD Demand Line must be below the
previous price bar’s low.
· “Exit if the
bar after the breakout bar opens below the breakout price level.”
· “Exit if the
bar after the breakout bar opens below the close of the breakout bar and closes
below the breakout price level.”
· “Exit if the
bar after the breakout bar fails to exceed the high of the breakout price bar.
Demark Trend Indicator
DeMark Trend Indicator is very simple and powerful indicator,
which draws two trendlines red and green.
When the price breaks out one of them that is signal to enter.
which draws two trendlines red and green.
When the price breaks out one of them that is signal to enter.
As you will see on the chart, the indicator draws Take Profit too.
This indicator is most profitable the higher the timeframe is.
It works great on M15, however H1 is even more profitable, since it has less market noise.
This indicator is most profitable the higher the timeframe is.
It works great on M15, however H1 is even more profitable, since it has less market noise.
Preffered pairs:
usd/jpy gbp/usd eur/usd usd/chf eur/jpy gbp/chf
usd/jpy gbp/usd eur/usd usd/chf eur/jpy gbp/chf
I hope this was helpful.
Please let me know if you need anything.
Sincerely Yours,
Austin Winston

Disclaimer The analysis we provide is based on the average estimate of price movements in one day. Does not guarantee what we deliver is actually a proper and correct. Everything that happens in the decisions you make on your trading transaction is to be Your responsibilities.
 Tweet
Tweet
No comments:
Post a Comment